With at least six lives lost and thousands of properties destroyed from raging wildfires, the summer of 2015 was a season of terrible devastation for Northern California. Large loss-causing fires—including the Valley, Butte, and Rocky wildfires—burned more than 216,000 acres and destroyed or damaged more than 3,000 structures.
Using industry-recognized wildfire risk management tools and models, we examined the Valley and Butte fires through the lens of a historical analysis of all fires occurring in California since 1990. Our objective was to answer several key questions: How bad was the summer of 2015 in terms of wildfires? What risk factors made the fires so challenging? Are we seeing a worsening trend?
Summer 2015 wildfire severity
Three static factors influence the effect of wildfire risk on property losses: fuel, slope, and access. The primary risk factor is a property’s proximity to vegetation—grass, trees, and scrubby or brushy vegetation—which provides fuel for a fire. Another important factor is topography, or slope, which influences the speed of wildfire spread. Finally, access—specifically lack of access—is a critical factor. We’ve learned through experience that when properties are on dead-end streets and in single-access neighborhoods, firefighters face more challenges.
In addition to examining the static risk factors, our analysis also considered time-dependent, weather-related factors. California experienced extreme drought conditions in the summer of 2015 with hardly any rainfall, and we found that to be significant. We also looked at wind patterns.
Even before the Valley and Butte fires erupted, our modeling established those locations as areas with high loss potential. Our assessment identified a large number of properties—later destroyed or damaged by those fires—to be at high risk based on location and vegetation risk factors.
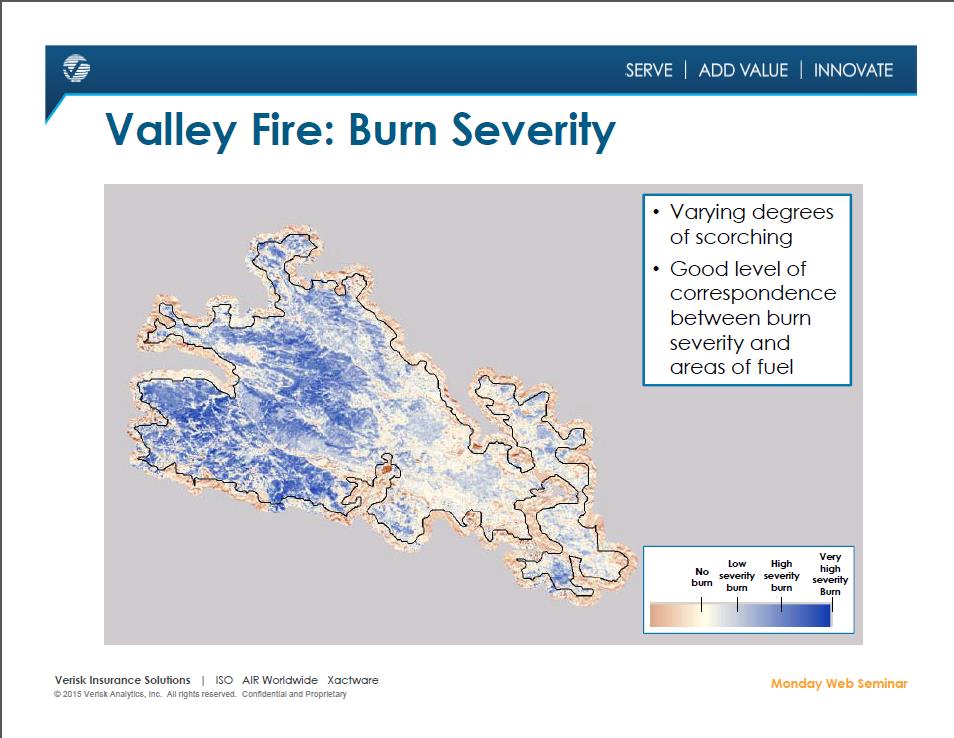
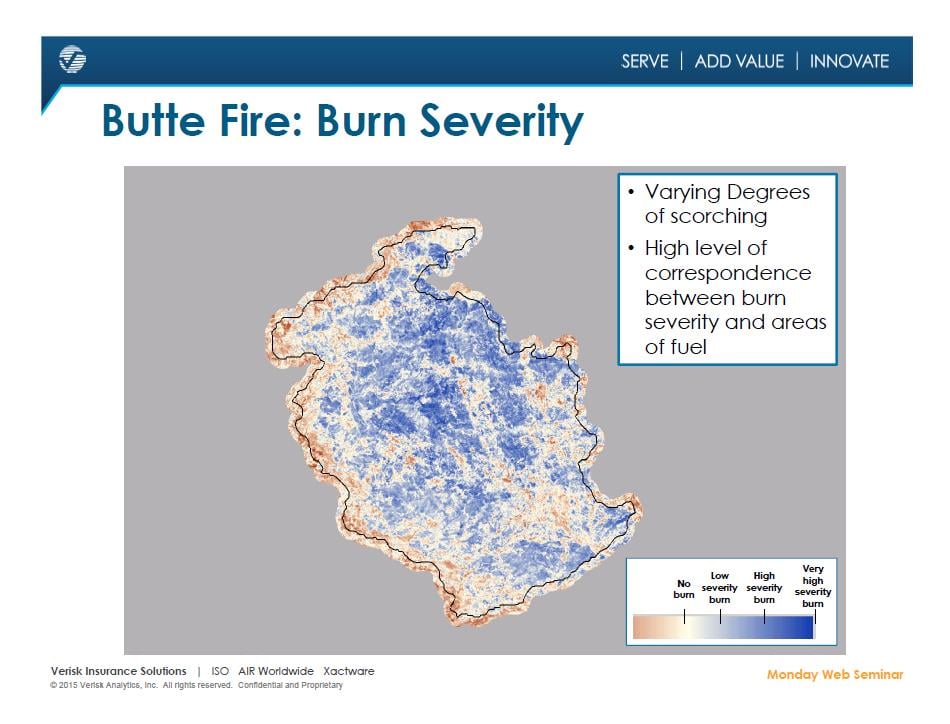
In both fires, we found a significant correlation between burn severity and the proximity of vegetative fuel. (See illustrations 1 and 2.) More frequently, people are building homes and other structures in the California foothills, former wildlands dominated by vegetation. In such an environment, called a wildland-urban interface (WUI) or intermix depending on proximity to wildland fuels, properties are at a higher risk for loss.
A good number of properties destroyed or damaged in the Valley and Butte fires were located on steep slopes, which can increase the speed and intensity of wildfire. Winds also played a role. We detected anomalous wind patterns in both fires, with gusts of 30 miles per hour. The winds helped spread the fires and made it difficult for firefighters to control the flames. The Valley and Butte wind patterns, however, didn’t approach the magnitude of the infamous 60-mile-per-hour Santa Ana winds responsible for fanning California’s most devastating wildfires.
Wildfire trends
Are wildfires on the rise in California, and if so, are they growing in severity? Traditionally, wildfire season in California is summer and fall, but there’s growing evidence to indicate it’s becoming year-round. However, the Valley and Butte fires don’t signal an increase in the severity of loss-causing fires. In fact, in terms of loss-causing fires that have occurred in California over the past 25 years, the Valley fire probably won’t break the top five when insured losses are adjusted for inflation.
If trended in today’s dollars, the total loss costs for the 1991 Oakland Hills fire—the greatest loss-causing fire in California’s history—would be about $4 billion. Other fires that most likely will surpass the Valley fire in severity when losses are trended to the present day include the Santa Barbara fire of 1990, the Laguna Beach fire of 1993, the Malibu/“Old Topanga” fire of 1993, the Cedar fire of 2003, the Old fire of 2003, and the Witch fire of 2007.
What does the future hold?
When can we expect another fire like this year’s Valley fire? An evaluation of historical data suggests that a wildfire causing as much or greater loss is likely to occur every three years or so. That’s not a new trend but a pattern that’s consistent with recent fire history. Since 1990, seven or eight such fires have occurred. Fortunately, the data also suggests that a fire causing losses on the magnitude of the Oakland Hills fire will be a much rarer occurrence.
Tomas Girnius, Ph.D., is a principal scientist, research and modeling department, at AIR Worldwide, a Verisk Analytics business.
Arindam Samanta, Ph.D., is a senior manager, underwriting products and analytics, for Verisk Insurance Solutions.